Driving sustainable Application Development success through data-driven insights.
Top 5 Metrics for Agile Success: Learn Key Indicators to Measure Agile Team Effectiveness
In the fast-paced world of software development, Agile teams thrive on delivering value quickly and consistently. But how do you know if your team is truly succeeding? The answer lies in measuring the right metrics—ones that focus on value produced rather than just activity logged. That's where Function Points (FP) come in as the foundation for objective, comparable benchmarks.
11/12/20254 min read
Why Function Points Are the Gold Standard for Measuring Value
Function Points (FP) measure the functional size of software delivered, independent of technology, language, or effort. Unlike story points (which are subjective and team-specific) or lines of code (which reward verbosity), FP quantifies what the user actually receives: inputs, outputs, inquiries, files, and interfaces. This makes FP ideal because:
It's standardized (via IFPUG or ISO/IEC 14143) and auditable.
It normalizes data across teams, projects, and organizations.
It focuses on business value, not hours burned or tasks completed.
It is measured in an objective, repeatable, auditable and thus defensible way.
It enables true benchmarking—compare your team to industry peers with confidence.
By anchoring metrics to FP, you shift from "How busy are we?" to "How much value are we delivering per unit of effort, cost, and time?"
Now, let’s dive into the top 5 metrics every Agile leader should track.
1. Project Delivery Rate (Effort hours spent per FP delivered)
Formula: Total Labor Hours ÷ Function Points Delivered
What it measures: Effort productivity—how many hours it takes to deliver one unit of functional value.
Why it matters: High hours per FP indicate waste: over-engineering, scope creep, or technical debt. Low hours per FP signal streamlined processes and skilled execution.
Agile benefit: Drives continuous improvement in estimation, automation, and waste elimination. Teams targeting < 10 hours per FP often outperform peers by 2–3x in throughput.
2. Cost Efficiency ($ spent per FP delivered)
Formula: Total Project Cost ÷ Function Points Delivered
What it measures: Financial efficiency—how much it costs to deliver one unit of functionality. Organizations that have outsourced agile teams, for instance, to India will see the effect of low labour rates (but probably different productivity) reflected in this metric.
Why it matters: In a world of fixed budgets, this metric directly ties Agile delivery to ROI. It exposes hidden costs like rework, support, or cloud overages, but also the effect of low or high hourly rates.
Agile benefit: Enables data-driven decisions on outsourcing, tooling, and staffing. Top-performing onshore teams achieve < $1,200 per FP, proving lean doesn’t mean cheap—it means smart.
3. Delivery Speed (FP delivered per Month)
Formula: Function Points Delivered ÷ Calendar Months (- inactive time)
What it measures: Throughput—how much functional value your team ships per month.
Why it matters: Speed isn’t just velocity; it’s value in the hands of users. FP per month reveals a sustainable pace, not just sprint bursts.
Agile benefit: Helps balance speed and quality. Industry leaders deliver 100–150 FP per month per team, enabling faster feedback loops and market responsiveness.
4. Sprint Quality (Defects per FP)
Formula: Defects found in Sprint ÷ Function Points Delivered in Sprint
What it measures: Internal quality—every defect found has an impact on team productivity as defects need to be logged, recreated, checked, resolved, tested, and fixing one defect often creates another one.
Why it matters: High defect rates erode trust, increase rework, inflate future costs, and slow velocity. Low rates prove your Definition of Done is rigorous. Leading teams shift quality left as much as possible, for instance, by implementing the ScopeMaster requirements quality analysis technology.
Agile benefit: Encourages built-in quality via TDD, pair programming, and automated testing. Aim for < 0.05 defects per FP to minimize rework and technical debt.
5. Product Quality (e.g., ISO 5055 Score)
What it measures: Structural quality of the codebase using the ISO/IEC 5055 standard—covering reliability, security, maintainability, and efficiency.
Why it matters: Even fast delivery means nothing if the product is fragile. ISO 5055 uses automated analysis to score code health objectively.
Agile benefit: Prevents "fast now, painful later." High ISO 5055 scores correlate with 30–50% lower maintenance costs and higher customer satisfaction.
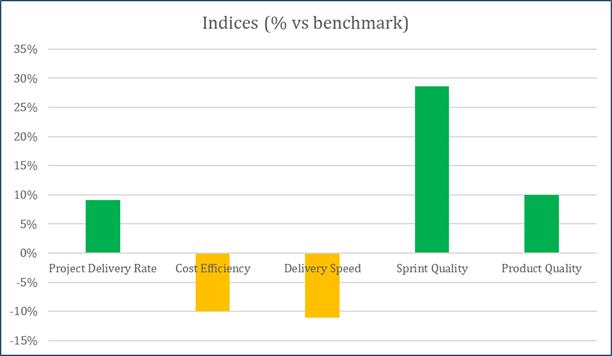
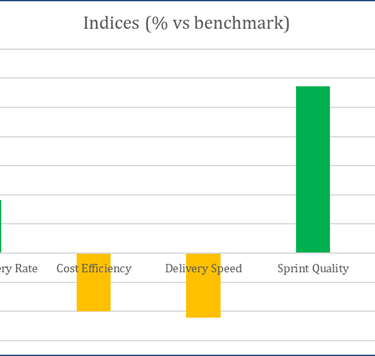
Tracking trends through time per team is a very powerful way to regain control over the value delivery. Benchmarking regularly against industry data is even more powerful as it shows where teams can really still improve. In the next figure, an example is given where the indices have been calculated for a team, where the indices show how well the team performed against industry average data in a percentage.
Figure 1: Team indices showing performance benchmarks against industry data
Organizations that implement these measurements really get transparency in their agile teams, value delivery, and can demonstrate being in control. Understanding which teams are already high-performers and which teams can use a bit of help to improve allows management to start improvement initiatives where needed.
The Path to Agile Mastery
Tracking these five metrics transforms Agile from a methodology into a data-driven discipline. You’ll uncover:
Where effort disappears.
Why avoiding rework matters.
Which practices actually move the needle?
Why external teams may be more expensive than internal teams.
How your team stacks up against industry benchmarks.
The result? Predictable delivery, lower costs, happier teams, and delighted stakeholders.
Ready to stop guessing and start measuring?
Subscribe to the AgileBenchmark.com newsletter for weekly insights, benchmark reports, and expert tips delivered to your inbox: link.
Visit our Agile Team Benchmark page to learn more about benchmarking your team’s performance against thousands of others: link!
Measure what matters, deliver what works!