Driving sustainable Application Development success through data-driven insights.
Story Points look stable. Delivered value collapses. Here's why most teams miss it. And how management thinks everything is fine!
You've probably seen this pattern play out more than once: • The team's velocity is beautifully predictable: X story points sprint after sprint. • Stakeholders cheer: "Good predictability, looking Great!" • Yet the product owner quietly panics: where is the new functionality we expected? • Deadlines slip, MVPs get delayed, budgets burn, and suddenly "we're very busy... but not much is shipping." The root cause? Story points measure effort invested, not value delivered. description. This blog will explain how to deal with this!
H.S. van Heeringen
1/21/20268 min read
Story Points look stable. Delivered value collapses. Here's why most teams miss it. And how management thinks everything is fine!
You've probably seen this pattern play out more than once:
The team's velocity is beautifully predictable: X story points sprint after sprint.
Stakeholders cheer: "Good predictability, looking Great!"
Yet the product owner quietly panics: where is the new functionality we expected?
Deadlines slip, MVPs get delayed, budgets burn, and suddenly "we're very busy... but not much is shipping."
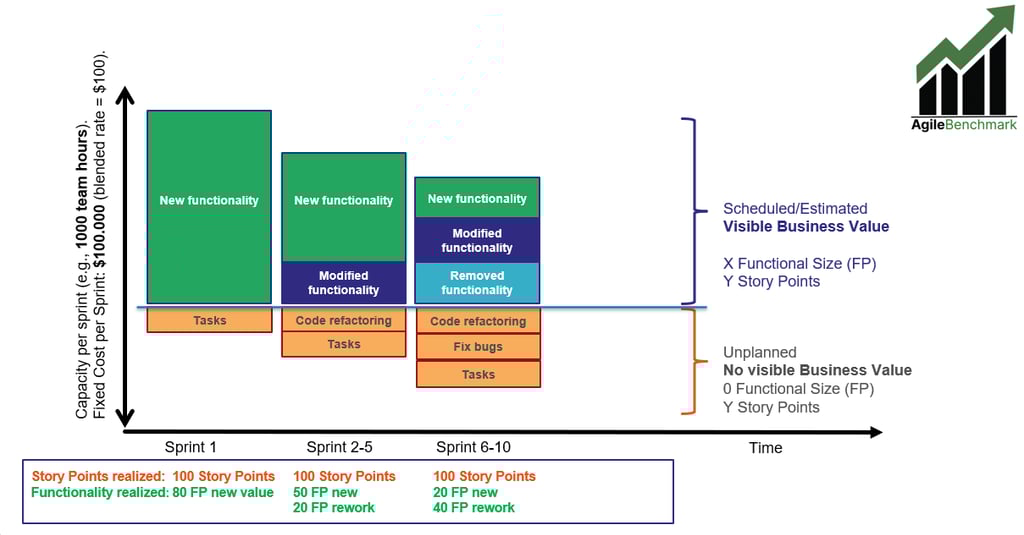
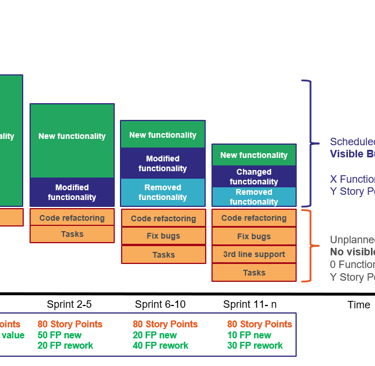
The root cause? Story points measure effort invested, not value delivered. Every task gets points: new features, bug fixes, refactoring, third-line support, "tech debt payback," miscellaneous chores. Story Point Velocity stays flat (or even climbs a bit as the team "gets better at estimating"), but the share of that capacity actually building visible business functionality shrinks over time. The charts below in four progressive stages — make this crystal clear:
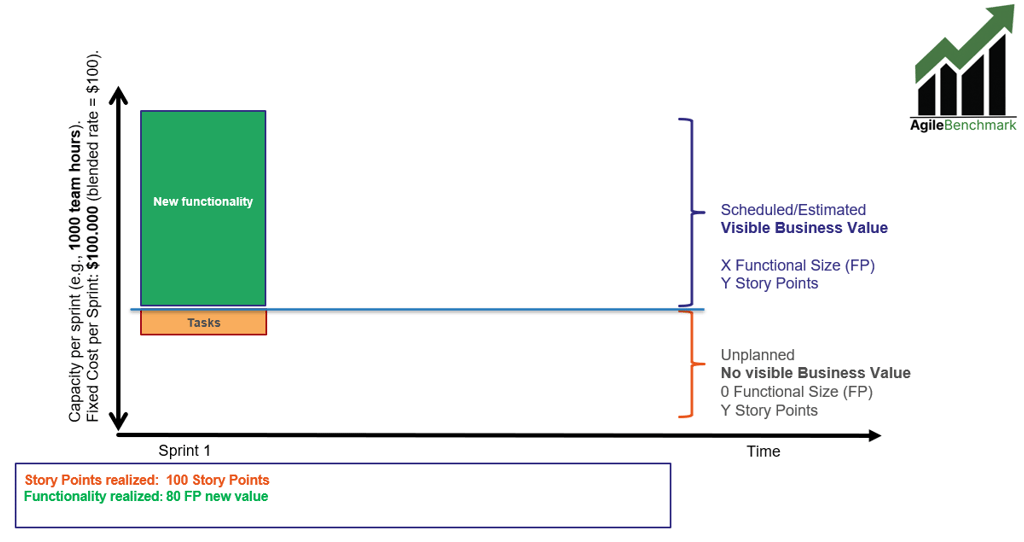
Fixed team capacity & cost per sprint (y-axis, e.g., ~1000 effort hours / ~$100k blended per sprint). Very predictable! So you are spending the amount of a very nice car every sprint... but what will you get for this?
Time and sprints on the x-axis.
Green blocks = new functionality (real business value). Modified and Removed functionality is also considered value, but also rework due to changed ideas, priorities or circumstances.
Everything else = necessary but non-value-adding work from the business perspective (rework, bug fixes, code refactoring, tasks that should ideally have been prevented).
Sprint 1 (Greenfield): much functionality delivered
In Sprint 1 everything looks healthy: almost all capacity goes to new, valuable functionality. There are always a few tasks, but they don’t consume a lot of effort (given that there was a sprint 0, where all the set-up activities were done).
New Functionality Delivered is measured using the new Nesma Easy Functional Sizing (EFS) method, which has been developed especially to allow agile teams to easily measure value delivered per sprint, allowing them to use standardized metrics as well (e.g., productivity, cost efficiency, delivery speed, quality), which brings many benefits to the team and the organization. In this case, the functional size delivered is 80 Nesma FP (EFS).
The number of committed and delivered story points was 100. Then comes the second sprint:
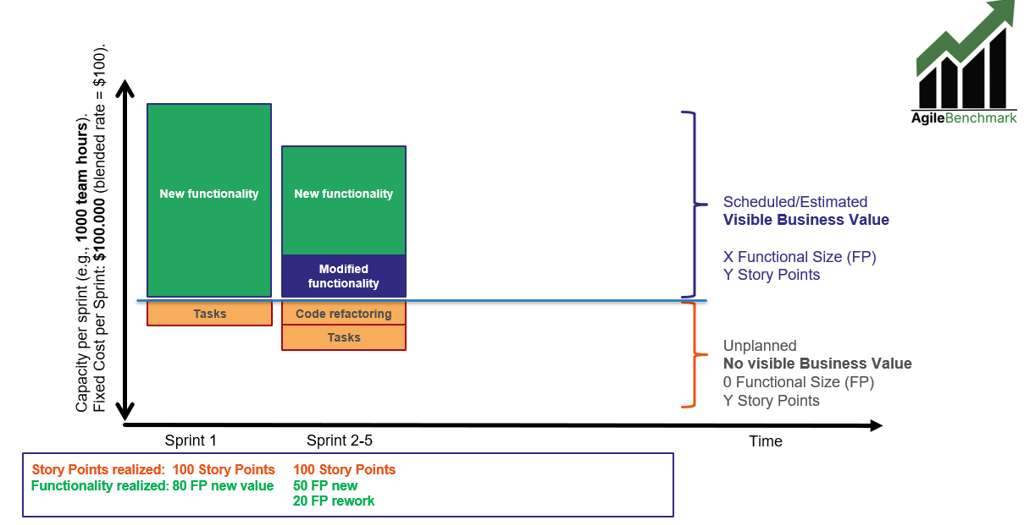
Sprint 2-5: somewhat less new functionality delivered for the $100k spent
Already in the sprint retro of sprint 1, chances are that the product owner says something like: ”This looks great, but I want this field on the right and coloured blue instead of green, and I want to include a label there. Let’s fix that next sprint.”. Also, as the team was working hard in sprint 1 to deliver the committed story points in time, they made some short-cuts in the code to be refactored next sprint, so some code refactoring is necessary as well.
So for sprint 2, we already see less capacity is spent on the green blocks, and some more effort is spent on other coloured blocks. As all activities that requires effort are granted story points, the number of story point delivered again is 100, so predictability is high! However, the amount of new functionality (business value) is somewhat lower.
If we consider modified and removed functionality also as (reworked)value, the functional size delivered has gone down from 80 to 70 (50 FP new, 20 FP modified). Note that the team is still spending 1.000 effort hours per sprint, which costs about $100.000 per sprint, but they simply spent some more time on activities that don’t bring visible value.
Then let’s move to the next stage.
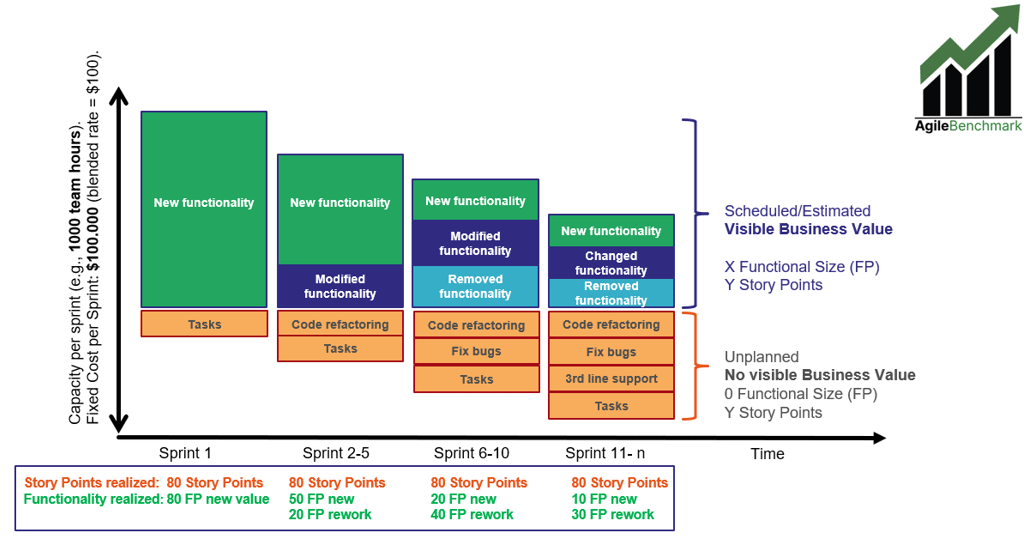
Sprint 6-10: less capacity spent on green blocks
Mid-project: some removed functionality, heavy bug fixing, more refactoring — green bars shrink dramatically despite constant story-point velocity. Bugs found in testing that can’t be resolved in the sprint are put ‘back on the backlog’ and sometimes teams even have to spent a whole sprint on code refactoring and/or fixing bugs. Needless to say, in these sprints zero new functionality is delivered.
However, it is still important to do these activities when necessary, but in general if previous sprints were executed correctly, and basic principles regarding for instance ‘Definition of Ready’ and ‘Definition of Done’ were followed, all this may have been avoided. It usually shows that the team was overconfident in previous sprints, committing to more than they could reasonably deliver, resulting in pushing these activities to the backlog.
So here, the effort spent on new, modified and removed functionality is lower again, resulting in fewer Nesma function points delivered (60 FP). However, story points remain constant at 100, as the effort spent per sprint also remains constant.
Management looking at the story point graphs will be excited to see such consistency in delivering 100 story points sprint after sprint. However, the product owner starts sweating as he realizes not nearly the amount of functionality is ready that he envisioned at this moment in time and the implementation date of the Minimum Viable Product may need to be delayed, or done with a product containing not nearly as much functionality as expected.
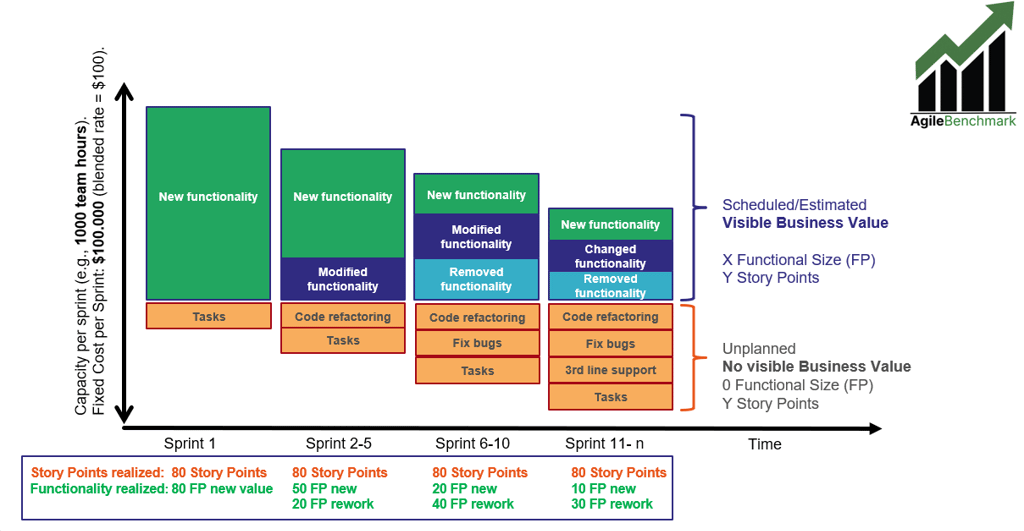
Sprint 11+: even less capacity spent on green blocks after Go Live
After the MVP finally goes live, things get even more hectic, as suddenly production incidents and user support activities may consume capacity as well. Long-term reality: the team is flat-out busy, story point velocity is rock-steady at 100 story points per sprint… yet barely any net new business value is landing. The budget is spent, ‘a nice car every sprint’, people are busy, but the business value outcome curve flattens or even declines.
Story points are fantastic for short-horizon sprint planning (next 1–3 sprints). They help teams feel safe, compare relative complexity, and smooth out planning poker conversations. But when you need to answer bigger questions:
Is our $X million investment actually delivering proportional value?"
"Can we hit the MVP date / regulatory deadline / investor milestone?"
"How much functionality per euro are we really getting over time?"
Story-point velocity alone is blind. It hides the silent shift from value creation to value preservation (or worse: value destruction via avoidable rework).
That's why serious organizations increasingly track functional size alongside story points. Functional size counts only the net business functionality added, modified, or removed that the end-user or business actually experiences — ignoring all the invisible "keeping the lights on" work.
There are many other benefits for using functional size measurement and metrics based on functional size, e.g.:
Early and reliable project estimation & budgeting — EFS allows sizing based on high-level functional user requirements, enabling more accurate cost, effort, and schedule forecasts right from feasibility or early sprint planning stages (often with accuracy comparable to more detailed methods but much faster).
Objective, technology-independent measurement — Functional size in EFS (like other FSM methods) measures what the business/user gets in terms of functionality, completely independent of programming language, tools, architecture, or development approach (Agile, DevOps, waterfall, etc.), making it ideal for cross-team, cross-vendor, or long-term comparisons.
Increased transparency and predictability at the management level — Nesma Easy Functional Sizing (EFS) delivers an objective, standardized, and quantifiable view of delivered functionality that is understandable and comparable across projects, teams, and time periods — independent of development method (Agile included), technology, or team-specific estimation styles. This creates clear visibility into true progress toward business outcomes (e.g., net functional growth vs. maintenance overhead), enables fact-based forecasting of delivery timelines and ROI, reduces surprises in status reporting, and supports confident decision-making at portfolio, program, or executive levels — turning "story points are stable but we're not shipping" into transparent, predictable value delivery metrics that align IT with business expectations.
Better control over scope changes & enhancements — Nesma methods (including EFS roots) excel at quantifying modifications, additions, and deletions in existing systems — perfect for tracking creep, measuring enhancement projects, or handling evolving MVPs without losing sight of net value added.
Improved productivity & performance benchmarking — By normalizing output to functional size (instead of story points or hours), organizations can calculate true productivity (e.g., function points per sprint/month), compare teams/projects/vendors objectively, and use industry data (like ISBSG or AgileBenchmark benchmark data) to identify improvement opportunities.
Reduced bureaucracy & faster learning curve — EFS is deliberately simplified (streamlined rules, fewer debates on classifications, only ~4 pages of core guidelines), making it accessible even for novices or agile teams — teams can learn and apply it quickly without heavy training, while still producing results comparable to traditional high-level Nesma/IFPUG counts (often within ~2% variance).
Stronger value-for-money insights & executive reporting — EFS provides a clear, quantifiable view of "functionality delivered per euro spent" over time, helping answer board-level questions like ROI on software investments, progress toward business outcomes, or justification for continued funding — especially critical when deadlines, MVPs, or fixed budgets are involved.
Support for agile & DevOps environments — Designed with modern practices in mind, EFS aligns well with iterative delivery: it tracks cumulative net functional growth sprint-over-sprint, helps size backlogs or epics early, and enables fair, scope-based contracting or performance metrics without forcing story points to double as value proxies.
Lower risk in contracting & supplier management — Using standardized, ISO-aligned sizing (EFS is part of the Nesma/ISO family) creates defensible, verifiable baselines for fixed-price work, outsourced development, or SLAs — reducing disputes over "what was delivered" and shifting focus to outcomes rather than inputs.
These benefits position EFS not as a replacement for story points in daily sprint planning, but as the essential companion metric for anything longer-horizon: portfolio management, investment decisions, performance trending, and proving real business value.
In conclusion, while story points remain a valuable tool for short-term sprint planning and fostering team collaboration, they fall short when organizations need to track genuine business value over the long haul. The visuals shown starkly illustrate how steady velocity can mask a creeping decline in delivered functionality — as more capacity gets consumed by rework, fixes, refactoring, and non-value-adding tasks — ultimately eroding ROI, delaying MVPs, and undermining trust between IT and the business.
By complementing story points with functional size metrics — especially the lightweight, agile-friendly Nesma Easy Functional Sizing (EFS) — teams and leaders gain an objective, standardized, and business-oriented view of net value delivered sprint after sprint. This shift reveals true progress, enables realistic forecasting, supports better budgeting and scope control, and answers critical executive questions: Are we getting proportional value for our investment? Can we confidently hit key milestones?
AgileBenchmark makes this transformation practical and impactful. With deep expertise in functional size measurement (Nesma certified CFPA), agile team benchmarking against international standards (including ISBSG data), and data-driven cost estimation, AgileBenchmark helps organizations implement these metrics seamlessly — whether through hands-on sizing support, custom dashboards tracking functional growth vs. overhead, productivity benchmarks, or output-based contracting aligned with guidelines like NPR 5333.
The result? Dramatically increased transparency into where budget truly creates value, and far greater predictability in delivery timelines, costs, and outcomes — turning "predictable velocity but disappointing results" into measurable, fact-based success that aligns IT performance with business goals.
Ready to move beyond illusionary stability and start measuring what actually matters? Reach out — let's discuss how your organization can adopt these insights and benchmarks today. Check the Agile Pulse Audit page for more information: link.
#AgileMetrics #FunctionalSize #ValueDelivery #SoftwareEstimation #NesmaEFS #AgileBenchmark #StoryPoints #ITManagement
If you think these posts are interesting, please consider registering to our newsletter: link, and please follow me on LinkedIn! If you wish to book a meeting to see how AgileBenchmark can help you, please use this form: